Note: This website was automatically translated, so some terms or nuances may not be completely accurate.
 Global Sentiment and Japanese Identity: Japan Brand Survey 2024 [2/5]
Intentions to Visit Japan and Regional Popularity Skyrocketing!? The Evolution of “Inbound Tourism” as Seen Through 10 Years of Data
Part 1 In the first installment, we analyzed the current state of the “Japan Brand” from eight perspectives based on the latest 2024 survey. In this second installment, we will focus specifically on “inbound tourism.” By reviewing past surveys to trace the changes that have led to the current situation, we aim to gain a deeper understanding of the global perception of Japan.
<Table of Contents>
▼80% of respondents still “like Japan.” Fans are on the rise in the U.S. and Australia
▼In the U.S., Australia, and India, where both favorability and intent to visit Japan have skyrocketed, and
Germany: Intentions to Visit Japan Skyrocketing Regardless of Favorability
▼From Hokkaido to Okinawa: Desire to Visit Regional Areas Is Also Skyrocketing!
▼Is the expanding range of things people want to do in Japan the key to the skyrocketing interest in visiting Japan and regional areas?
▼Japanese cuisine—a key motivator for inbound tourism — is gaining both breadth and depth!
80% of respondents still “like Japan.” The number of fans is growing in the U.S. and Australia
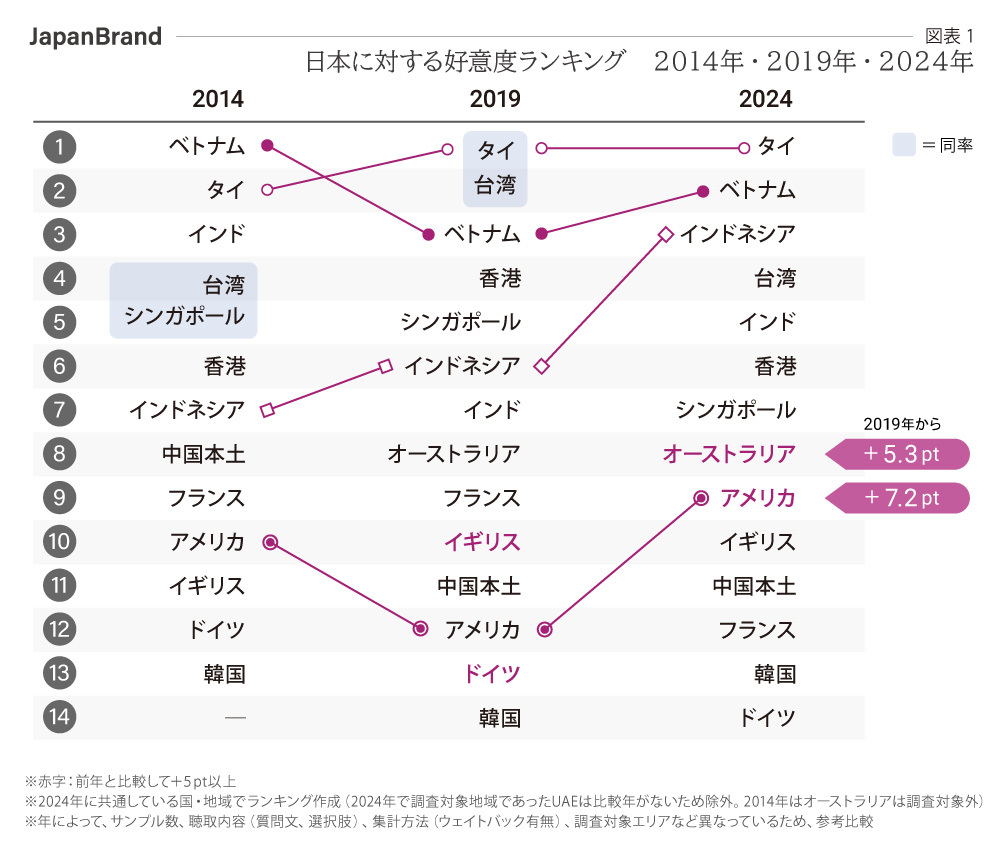
The Japan Brand Survey continuously gauges favorability toward Japan. According to the 2024 results, approximately 80% of respondents overall answered “like” Japan, maintaining a high level of favorability unchanged from 10 years ago. When comparing by country and region, Asia remains at the top, though the rankings have shifted slightly, with Southeast Asian countries now occupying the top three spots.
Meanwhile, looking at countries outside Asia, the U.S. has climbed in the rankings, with its score rising significantly by +7.2 points compared to five years ago (and +8.0 points compared to ten years ago). Australia, though its ranking has remained unchanged since 2019, has seen its score rise by +5.3 points. With the number of tourists visiting Japan also increasing in both countries, it is evident that growing favorability is leading to heightened interest in and engagement with Japan.
The United States, Australia, and India—where both favorability and intent to visit Japan have skyrocketed—and Germany, where intent to visit Japan has skyrocketed regardless of favorability
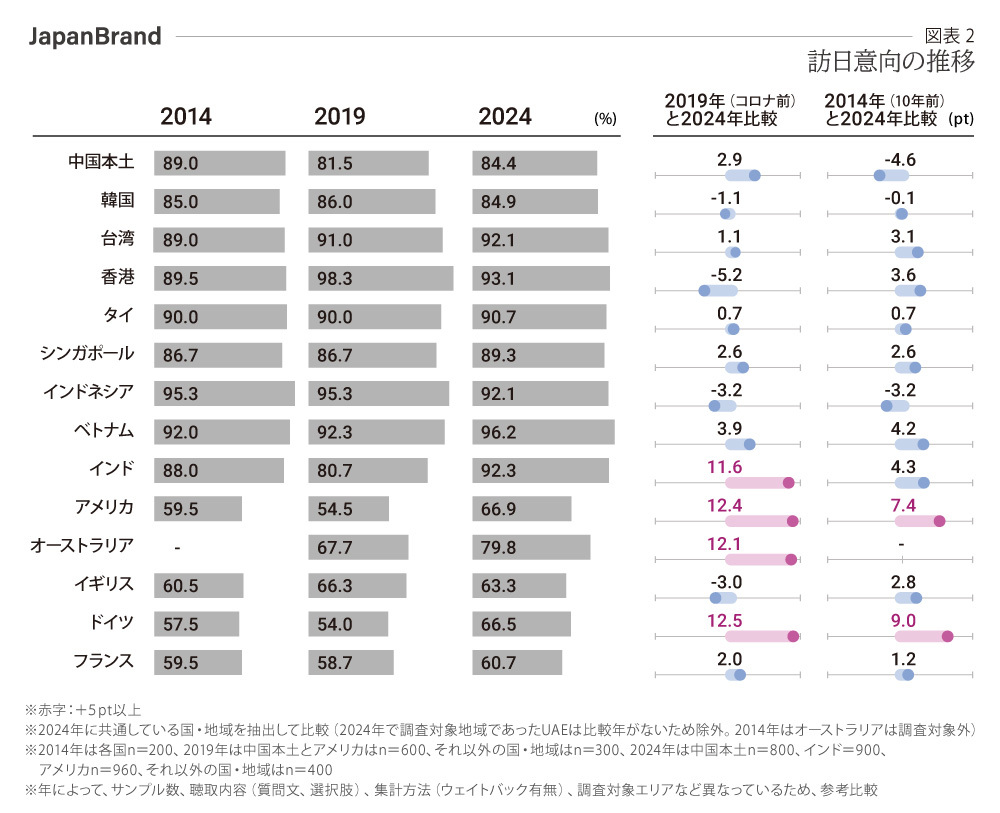
Tracking trends in the intention to visit Japan since we began surveying 10 years ago reveals that, while some countries saw a temporary dip in 2019, many have generally maintained or improved their scores. In particular, compared to 2019—just before the COVID-19 pandemic—scores have skyrocketed by more than 10 points in the U.S. and Australia, where favorability has risen, as well as in India, which has returned to the top 5 in the rankings.
As I’ve noted in past articles, it’s likely that a fondness for Japan is driving the intention to visit. On the other hand, Germany stands out as a country that has significantly increased its intention to visit Japan, even though favorability has not risen compared to 2019.
Germany has the second-highest number of outbound travelers after mainland China and is considered one of the world’s leading travel nations. It can be inferred that Germans, who are accustomed to traveling abroad, appreciate Japan’s appeal as a travel destination regardless of their overall favorable impression of the country. Rather than visits driven solely by a favorable impression of or interest in the “Japan brand,” we can also expect a scenario where a visit to Japan fosters a favorable impression and further broadens interest in the Japan brand.
From Hokkaido to Okinawa, interest in visiting regional areas is skyrocketing!
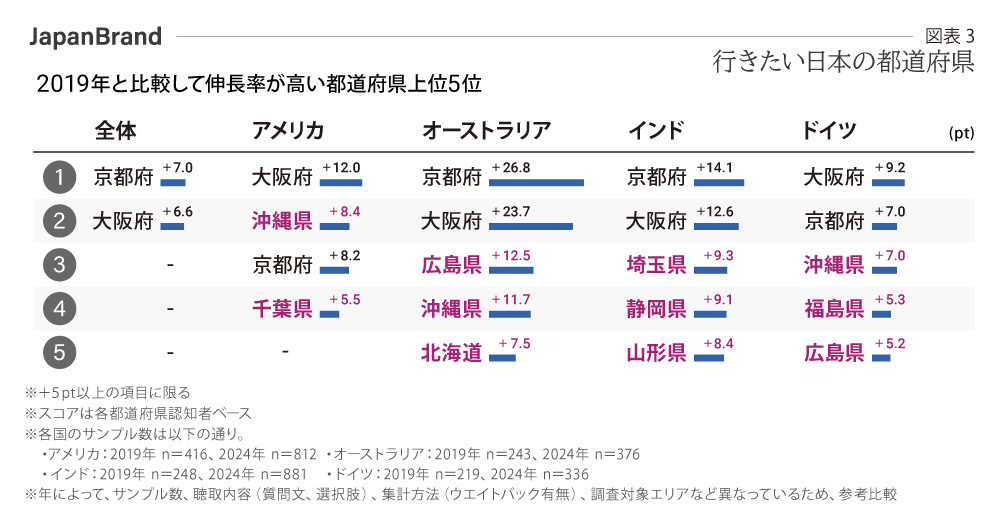
When I visit Kyoto, I used to get the impression that there were many tourists from Asia, but now I’m surprised by the large number of tourists from Europe and the United States. This trend is also evident when compared to the past. When compared to pre-COVID (2019), when many countries saw significant changes in their intention to visit Japan, the scores for “Kyoto” and “Osaka” as preferred destinations increased overall.
Furthermore, this trend is evident in the United States, Australia, India, and Germany—countries where the intention to visit Japan has risen significantly—with some countries seeing score increases of 10 points or more. Additionally, distinct patterns emerged in each country regarding destinations other than Kyoto and Osaka.
In the United States and Australia, where interest is focused on “Okinawa” or “Hokkaido”; in India, where interest is centered on “Saitama,” “Shizuoka,” and “Yamagata”—destinations within easy reach by train or Shinkansen from Tokyo; and in Germany, where travelers are accustomed to international travel, interest is growing in historical sites such as “Fukushima” and “Hiroshima” (with “Nagasaki” coming in a close second, though not listed in the table).
Morioka City was selected for The New York Times’ “52 Places to Go in 2023,” and Yamaguchi City was chosen for “52 Places to Go in 2024.” The growing attention on Japan’s regional areas is likely a key factor behind the significant surge in interest in visiting Japan.
Is the widening range of things people want to do in Japan the key to the explosive growth in interest in visiting the country and its regional areas?
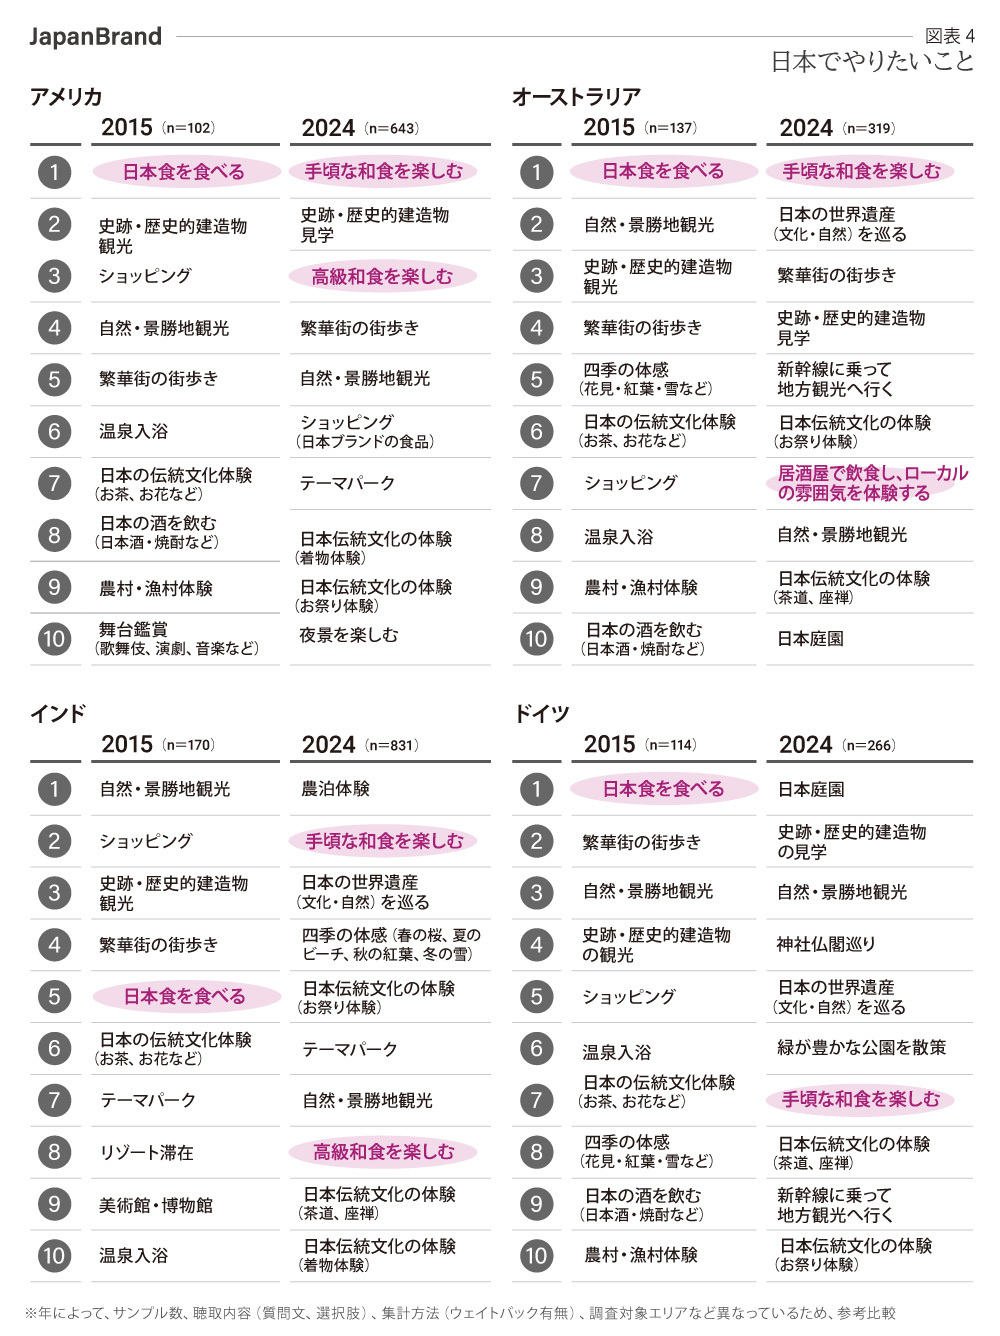
So, what lies behind this broadening range of places people want to visit in Japan? Although the specific options differ, when we compare the top 10 items in the “Things to Do in Japan” category from the 2015 survey (conducted about 10 years ago) with those from the 2024 survey for reference, the results reveal noticeable changes in the content.
“Japanese cuisine” has ranked among the top things people want to do in Japan since the 2015 survey. This trend remains unchanged in the United States, Australia, and India; in fact, the 2024 survey’s top rankings include two food-related items, indicating a strong desire to experience Japanese cuisine from various perspectives.
In India, in particular, while interest in Japanese cuisine was not particularly high a decade ago compared to other countries and regions, the 2024 survey results show that its ranking has risen, suggesting that interest in Japanese cuisine itself has increased significantly.
On the other hand, in Germany, there has been a rise in interest in purely sightseeing activities—such as “visiting Japanese gardens” and “touring shrines and temples”—over Japanese cuisine itself, clearly reflecting the preferences of travel-loving Germans.
Furthermore, in Australia, India, and Germany, items such as “visiting Japan’s World Heritage sites” and “taking the Shinkansen to explore regional areas” also ranked highly. This reaffirms that the diversification of these “things to do in Japan” is driving the aforementioned growing interest in regional travel.
Japanese cuisine—a key motivator for inbound tourism—is gaining both breadth and depth!
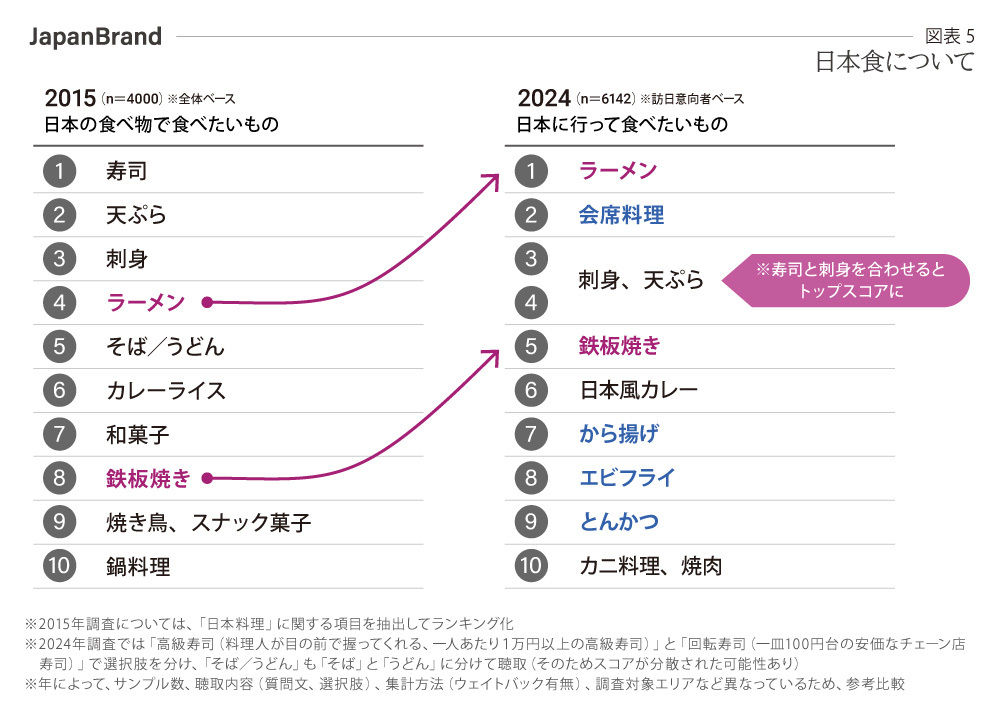
Finally, let’s take a look at the growing popularity of Japanese cuisine, which has become a major motivation for visiting Japan. In a survey conducted about 10 years ago in 2015, when respondents were asked what Japanese dishes they wanted to eat, “sushi,” “tempura,” and “sashimi” were the top three.
In the 2024 survey, we asked, “What would you like to eat when visiting Japan?” and the results showed that “ramen” took the top spot by a wide margin. Additionally, “kaiseki cuisine” was cited as a traditional Japanese dish, and entertaining Japanese culinary experiences such as “teppanyaki” moved up in the rankings.Furthermore, fried foods like “karaage” and “tonkatsu,” as well as Western-style dishes such as “ebi-furi” (fried shrimp), ranked highly, suggesting that the breadth and depth of Japanese cuisine people wish to experience are expanding.
We can see that a positive cycle is emerging: as the range of culinary experiences people wish to try—from time-honored “traditional Japanese cuisine” to more casual everyday fare—continues to expand, this further boosts inbound tourism intentions.
In this report, we examined trends from the Japan Brand Survey—which has been conducted for over 10 years—from the perspective of “inbound tourism.” We have moved beyond the stereotypical perception that “Japan means Tokyo” and “Japanese cuisine means sushi.” Over the past decade, information about Japan has increased, gaining both breadth and depth, and this has helped drive inbound tourism. The survey results clearly confirm what many people likely intuitively sense.
We anticipate that tourists will increasingly seek out diverse experiences and visit all corners of Japan. Building on this foundation, the Japan Brand Survey Project Team intends to continue exploring how we can create more opportunities for even more people to engage with the Japan brand.
[Contact Information for Inquiries Regarding This Matter]
Dentsu Inc., Japan Brand Project Team
japanbrand@dentsu.co.jp
Japan Brand Research Hub Page
https://www.dentsu.co.jp/knowledge/japan_brand/
[Purpose of the Dentsu Inc. Brand Survey]
Launched in 2011—when the Great East Japan Earthquake led to reputational damage affecting Japanese agricultural and marine products as well as inbound tourism—this is Dentsu Inc.’s proprietary commercial marketing research initiative designed to understand how products and services originating in Japan are perceived globally.The Japan Brand Survey regularly assesses overseas consumers’ perceptions and actual behaviors regarding the Japan brand as a whole, covering areas such as overseas travel, inbound tourism, culture, regional revitalization, Japanese cuisine, Japanese products, and lifestyle. By visualizing shifting consumer sentiments as well as the challenges and potential of the Japan brand, the survey contributes to increasingly complex corporate activities while also promoting cross-cultural understanding within Japanese society.
[Dentsu Inc. Brand Survey 2024: Survey Overview]
・Target Areas: 15 countries and regions (United States, Australia, United Kingdom, Germany, France, India, United Arab Emirates, Indonesia, Singapore, Thailand, Vietnam, Mainland China, Hong Kong, Taiwan, South Korea)
・Sample Size: 7,460 (Breakdown: United States 960, India 900, Mainland China 800, other countries and regions 400 each)
・Survey Period: January 19–March 26, 2024
・Eligibility criteria: Men and women aged 20–59 (middle-income and above)
・Survey Method: Online survey
・Research Organizations: Dentsu Inc. (Principal Investigator), Video Research Ltd. (Implementation Partner)
[Notes and Disclaimers]
*1: The target areas in mainland China are primarily Tier 1 cities; in India, they are Delhi, Mumbai, and Bengaluru; in Australia, the Sydney metropolitan area; and in Southeast Asia, they are primarily metropolitan areas.
*2: Definition of middle-income group: Criteria were established for each country based on average national income figures (such as OECD statistics) and socio-economic classification (SEC).
*3: Samples were collected using equal allocation by gender and age group in each country and region, and the data was weighted to reflect the respective population distributions.
*4: Since the composition ratios in this survey are rounded to the second decimal place (or to the first decimal place where displayed as whole numbers), the totals may not add up to 100%.
*5: In creating the charts and tables for this survey, the names of the countries and regions analyzed use the international standard ISO country codes (ISO 3166-1 alpha-2/3), with a few exceptions.
United States/US/USA, Canada/CA/CAN, Australia/AU/AUS, United Kingdom/UK/GBR, Germany/DE/DEU, France/FR/FRA, Italy/IT/ITA,Spain/ES/ESP, Finland/FI/FIN, United Arab Emirates/UAE, Saudi Arabia/SA/SAU, India/IN/IND, Indonesia/ID/IDN, Singapore/SG/SGP, Malaysia/MY/MYS, Philippines/PH/PHL, Thailand/TH/THA,Vietnam/VN/VNM, Mainland China/CN/CHN, Hong Kong/HK/HKG, Taiwan/TW/TWN, South Korea/KR/KOR
*6: The names of countries and regions used in this survey report and on our website are based on the Japanese government’s long-standing position, as well as Japanese social norms and business practices.
*7: The names of countries and regions used in this survey are for statistical or analytical convenience only and do not imply any political stance or opinion.
*8: The maps used in this survey (world map and map of Japan) have been partially modified and cropped to suit the analysis content and page layout; therefore, they may not necessarily reflect national borders and territorial boundaries accurately.
*9: As a commercial marketing research study aimed at understanding the lifestyle habits and brand preferences of general consumers, this survey has been conducted consistently since its inception through commissioned fieldwork partners, in strict compliance with local laws, regulations, and public order and morals.Surveys conducted in China are carried out through fieldwork contractors who have obtained the “Foreign-Related Survey Permit” required by Chinese authorities; our company does not conduct market research activities within China itself. Furthermore, we monitor and review our operational procedures as necessary in light of developments such as changes in laws and regulations.
*10: The response data collected through this survey is obtained, managed, and processed lawfully in accordance with the relevant laws and regulations of each target market. The data we receive consists solely of aggregated data that has been anonymized in a manner that does not allow for the identification of specific individuals and cannot be reversed; it does not contain any personal information.
Was this article helpful?
Share this article


Newsletter registration is here
We select and publish important news every day
For inquiries about this article
Back Numbers
Author

Katsura Nakazato
Dentsu Inc.
Fourth Marketing Bureau
Communications Director
Japan Brand Survey 2015Reflecting on Japan's Present and Future Through the 2019 Japan Brand SurveyExploring Japan's Potential Through Dentsu Inc. Japan Brand ResearchGlobal Sentiments and Japanese Identity: Japan Brand Survey 2023Global Sentiment and Japanese Identity: Japan Brand Survey 2024Insights from Overseas Residents in Their 15th Year: Japan Brand Survey 2025