Note: This website was automatically translated, so some terms or nuances may not be completely accurate.
 Global Sentiment and Japanese Identity: Japan Brand Survey 2024 [1/5]
[Report] Understanding the Current State of “Japan Brands” Through 8 Key Points
Launched in 2011, the Japan Brand Survey is Dentsu Inc.’s proprietary commercial marketing research initiative designed to gauge the perceptions and actual behaviors of overseas residents regarding the Japan brand as a whole—including inbound tourism, the food sector, Japanese products, content, and values.
Now in its 14th year, this survey continues to evolve its target regions and research topics in line with changing trends. It not only contributes to corporate activities that are becoming increasingly data-driven, diverse, and complex but also continues to disseminate insights to Japanese society.
In 2024, we conducted a large-scale survey covering 15 countries and regions (the United States, Australia, the United Kingdom, Germany, France, India, the United Arab Emirates, Indonesia, Singapore, Thailand, Vietnam, Mainland China, Hong Kong, Taiwan, and South Korea). (For a summary of the survey, see here ).
As marketing professionals and as individual consumers, we sincerely hope that all of our members will continue to make small but meaningful contributions to cross-cultural understanding.
Introduction
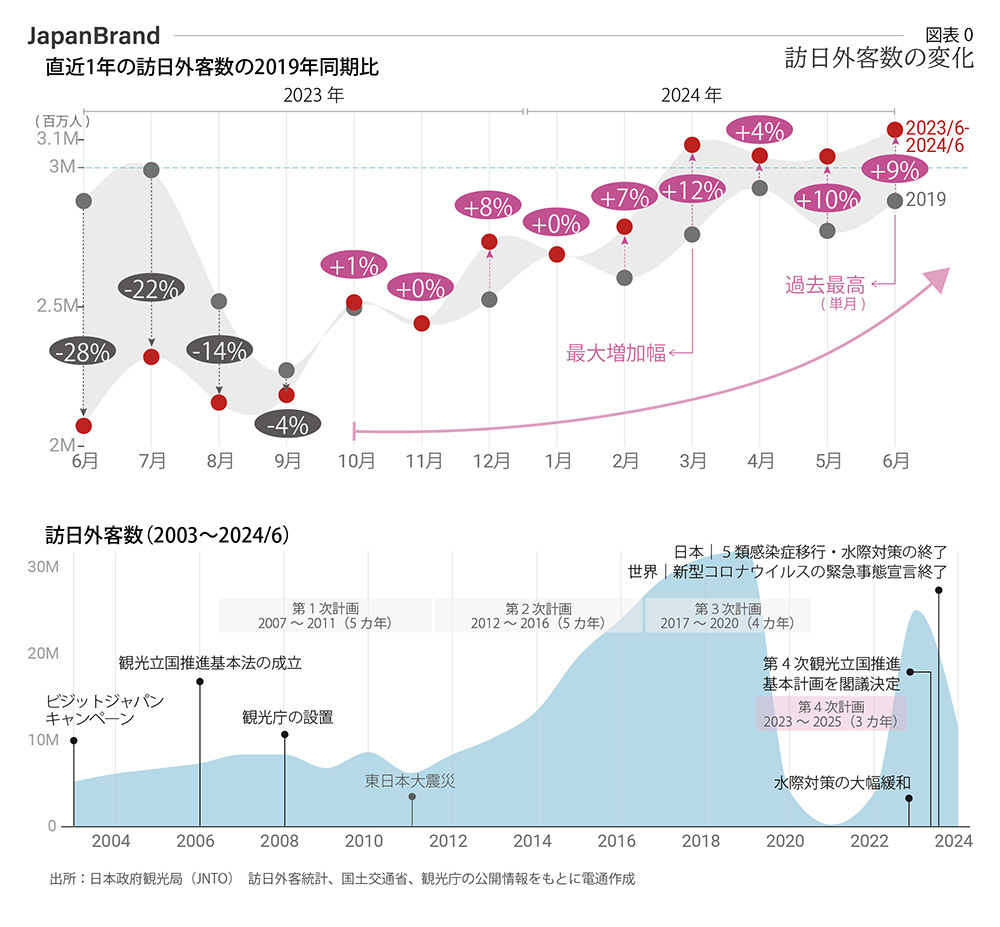
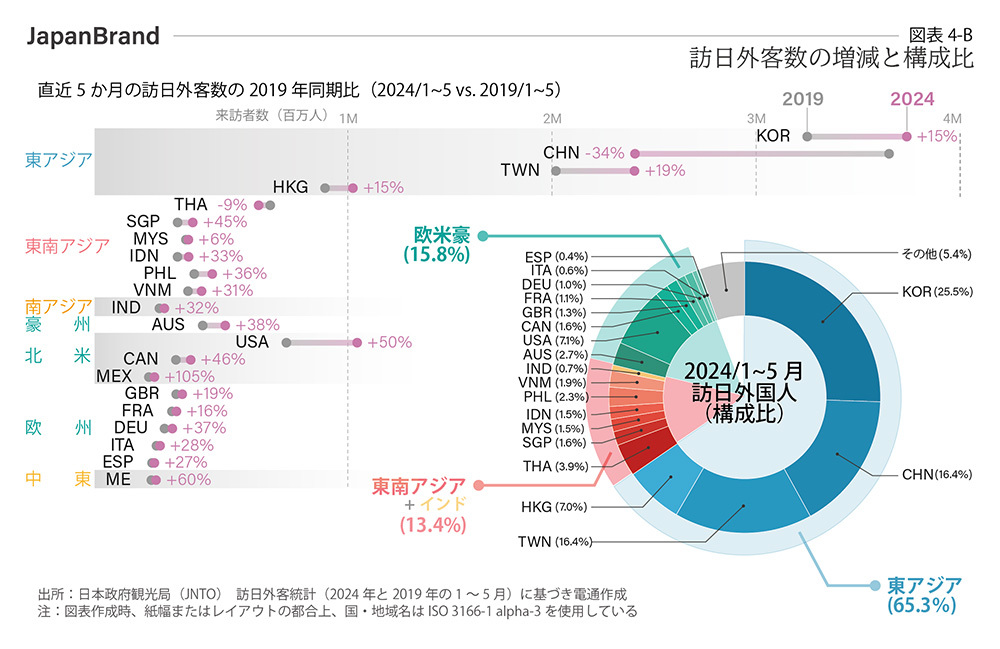
Until now, Western countries have consistently dominated the top spots in various rankings measuring national power and popularity. Against this backdrop, Japan stands out as one of the few Asian countries to have become a regular fixture on “most attractive countries” rankings. According to the latest statistics from the Japan National Tourism Organization (JNTO), the number of foreign visitors to Japan exceeded 3 million for four consecutive months from March to June 2024.Furthermore, the number of visitors has continued to exceed the figures for the same months in 2019—when a record high was set—for nine consecutive months (*Note: Figures for November 2023 and January 2024 were roughly on par with those for the same periods in 2019). [Chart 0]
In this series, we will analyze Japan’s popularity from this macro perspective, drawing on the latest Japan Brand Survey and applying Dentsu Inc.’s unique multifaceted approach. We will also explore the challenges hidden beneath this popularity phenomenon and seek insights that can help expand Japan’s potential.
In the first installment of this series, we will introduce the key findings of the latest survey through eight key points, and we hope this will help you grasp the current state of the Japan brand.
Point 01: Expectations
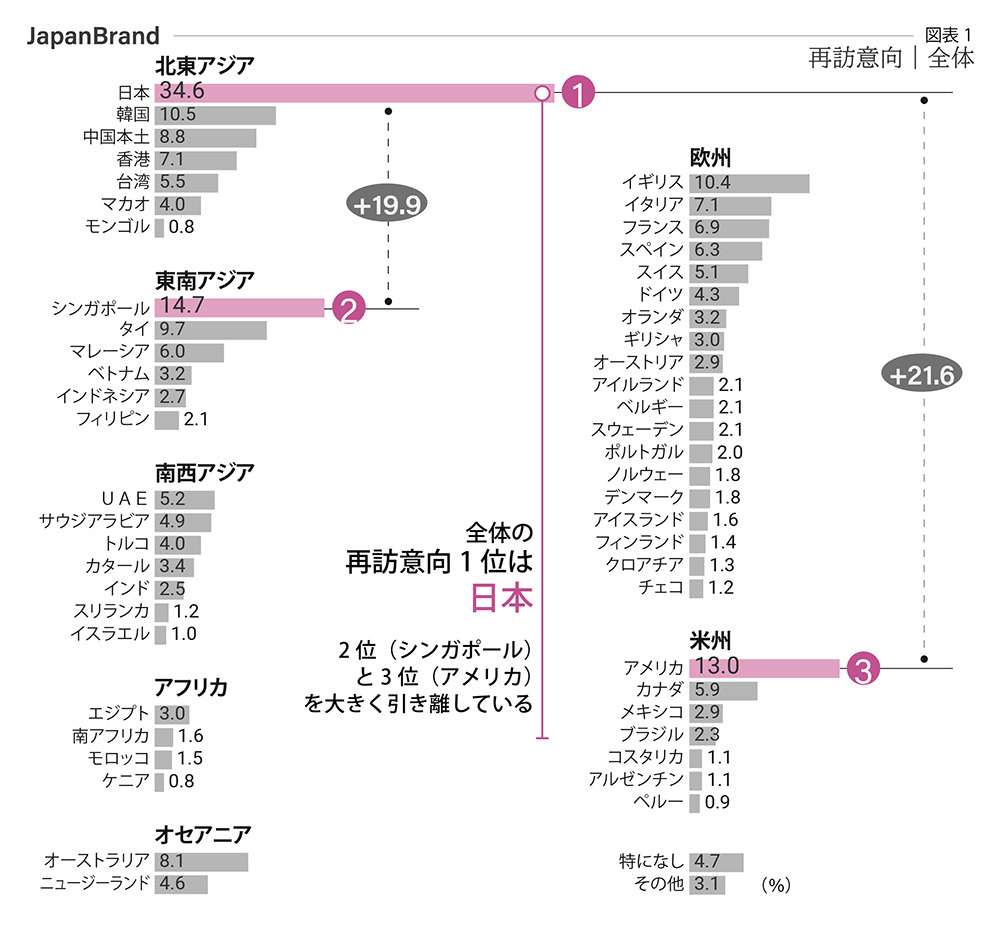
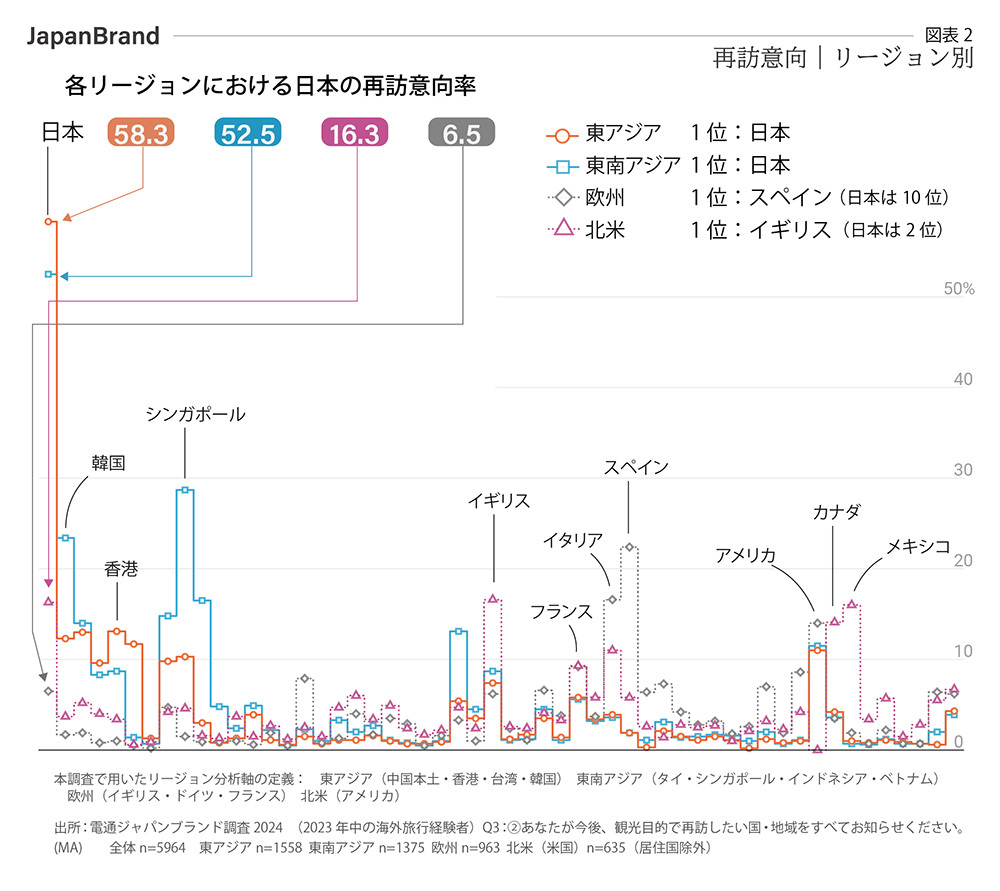
When we surveyed people who had traveled abroad after the pandemic (in 2023) about their intention to revisit their travel destinations, Japan ranked first. Moreover, it outperformed second-place Singapore and third-place the United States by nearly 20 percentage points. [Chart 1]
When viewed by region rather than by country, Japan ranked first in revisit intent in both East Asia and Southeast Asia. The gap between Japan and Hong Kong (13.1%), which ranked second in East Asia, was 45.2 percentage points, and the gap between Japan and Singapore (28.7%), which ranked second in Southeast Asia, was 23.8 percentage points—a significant lead over the runners-up.
On the other hand, Japan’s ranking dropped slightly in Europe and North America, placing 10th in Europe (with Spain in first place) and second in North America (with the United Kingdom in first place). In other words, it is clear that Japan’s popularity as a tourist destination is overwhelmingly supported by Asian travelers. [Chart 2]
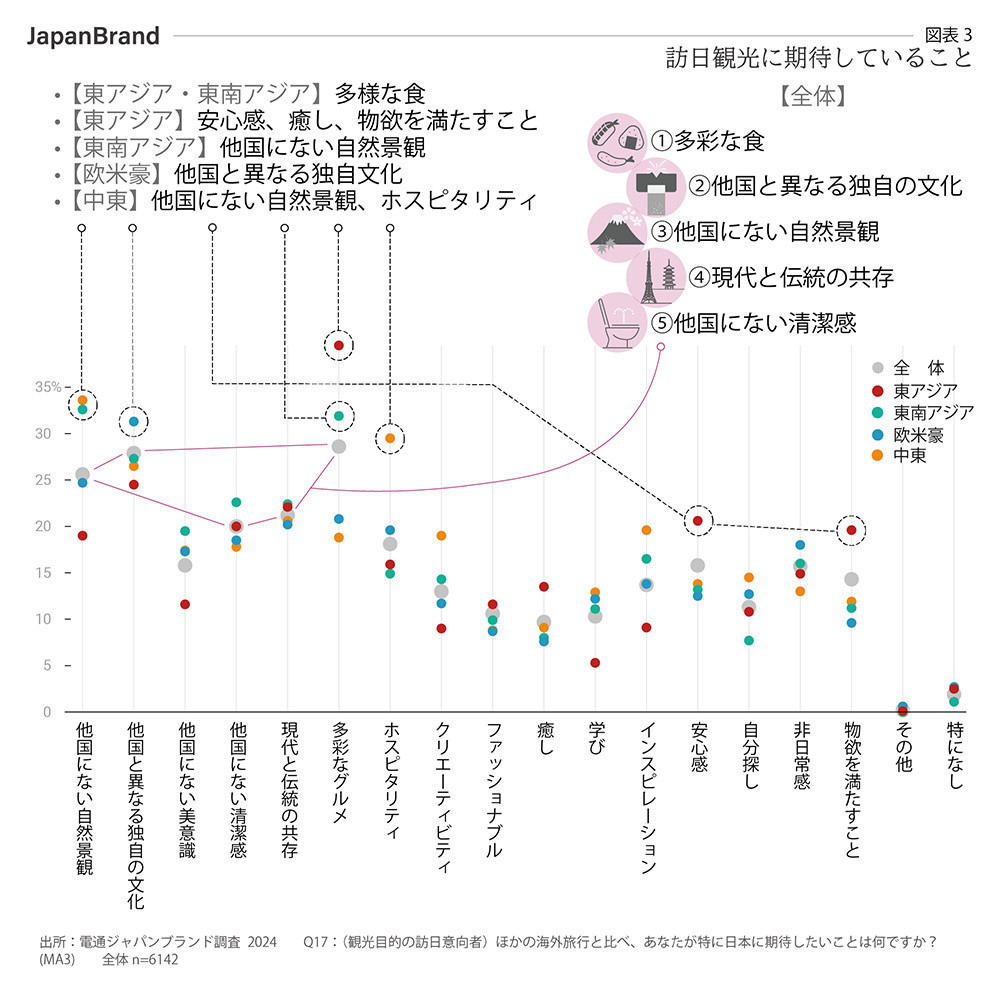
Regarding Japan, which is recognized as an attractive travel destination, overseas residents had the following five main expectations:
① Diverse cuisine
② A unique culture distinct from other countries
③ Natural landscapes not found in other countries
④ The coexistence of modernity and tradition
⑤ A level of cleanliness not found in other countries
In terms of regional characteristics, East Asia and Southeast Asia share a common expectation for “diverse cuisine”; within East Asia, expectations for “a sense of security” and “satisfaction of material desires” are particularly high, while in Southeast Asia, expectations for “natural landscapes found nowhere else” stand out.
On the other hand, respondents from Europe, the U.S., and Australia show relatively high interest in “unique cultures distinct from other countries,” while those in the Middle East tend to expect not only “natural landscapes found nowhere else” but also “hospitality,” “creativity,” and “inspiration.” [Figure 3]
Point 02: Motivating Factors
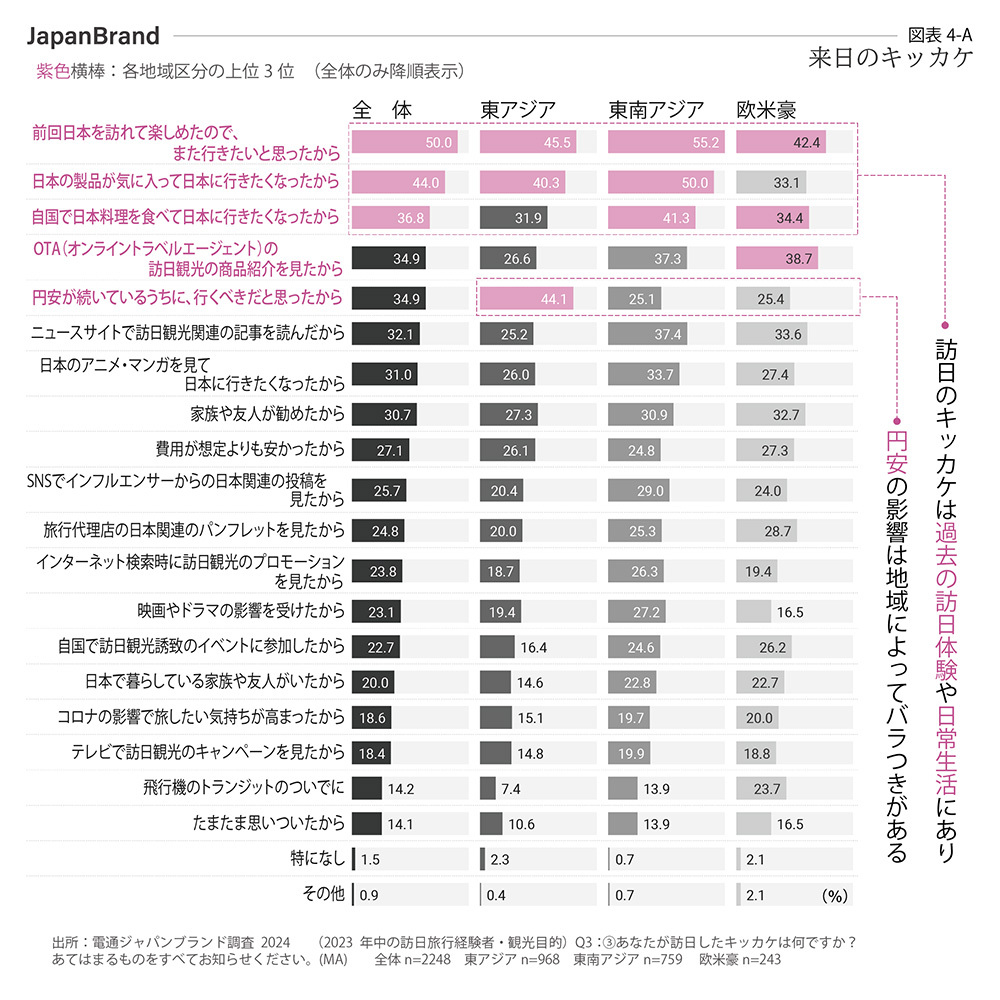
While the historically weak yen is often cited as the primary driver of the boom in inbound tourism, the survey reveals that across all regions, the biggest motivator for visiting Japan is “previous experiences in Japan”; positive past experiences are consistently leading to repeat visits.
These survey results have reminded us once again just how satisfying the pre-pandemic tourism experience in Japan was for international visitors. Looking at it another way, this highlights the urgent need for both the public and private sectors to consider what approaches should be taken going forward to maintain this level of satisfaction.
Next, when comparing the East Asian market—the largest source of visitors—with the European, American, and Australian markets, which have seen relatively large increases in visitor numbers, we found that the factors ranking second and lower among the reasons for visiting Japan differed significantly. While “a weak yen” is a key motivator in East Asia, it is presumed that Online Travel Agents (OTAs) have a greater influence in Europe, the Americas, and Australia.
Furthermore, a common finding across all regions is that “Japanese products” and “Japanese cuisine”—elements with which visitors have had contact in their daily lives—also serve as important motivators that provide a definite nudge toward visiting Japan. In other words, the “Japan brand,” as broadly promoted locally, contributes to the promotion of inbound tourism, and the two can be viewed as two sides of the same coin. [Figures 4-A, 4-B]
Point 03: Interest
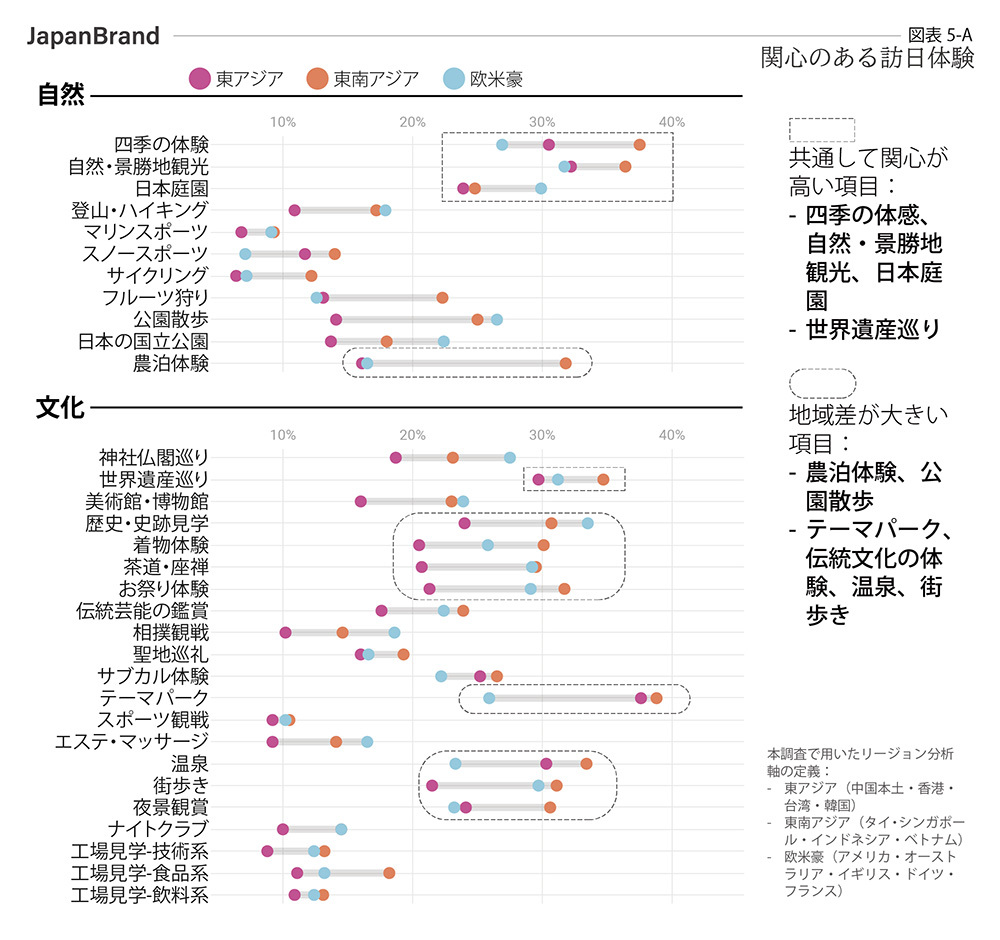
One of the items given the highest priority in this survey is “experiences in Japan that respondents are interested in.”
By regularly observing what people want to do, where they want to go, and what they want to buy when visiting Japan, we can identify various trends—such as what changes and what remains constant, as well as what aligns with our intuitive understanding and what feels out of place—and gain valuable insights.
First, let’s look at the nature and culture categories. Experiencing the four seasons, nature tourism, Japanese gardens, and visiting World Heritage sites are all items that consistently attract high levels of interest.
Southeast Asia showed the greatest interest in farm-stay experiences. It is clear that Europe, the U.S., and Australia have high selection rates for park-related activities, in contrast to East Asia. Interest in farm-stay experiences is by far the highest in Southeast Asia, with a gap of more than double that of East Asia, Europe, the U.S., and Australia.
Furthermore, regarding traditional cultural experiences—such as theme parks, hot spring experiences, kimono and tea ceremony, and festivals, which are staple activities for tourists visiting Japan—a marked difference was observed between East Asia and Europe, the U.S., and Australia. [Figure 5-A]
Next, let’s look at the shopping, dining, lodging, and transportation categories. Japanese-brand food products and Japanese cuisine-related items are consistently high on the list of interests. Japanese cuisine ranks among the top choices for experiences regardless of region, and its popularity is beyond doubt. Furthermore, Asia continues to be a key target market for Japanese-brand cosmetics. It is immediately apparent that over-the-counter (OTC) medications—which can be purchased without a prescription—are gaining support among consumers in East Asia.
Regarding accommodation, which accounts for a large proportion of spending, significant regional differences can be observed in interest in hot spring inns. As for transportation, the results show a high intention to use urban transit (trains, subways, buses) and the Shinkansen. [Figure 5-B]

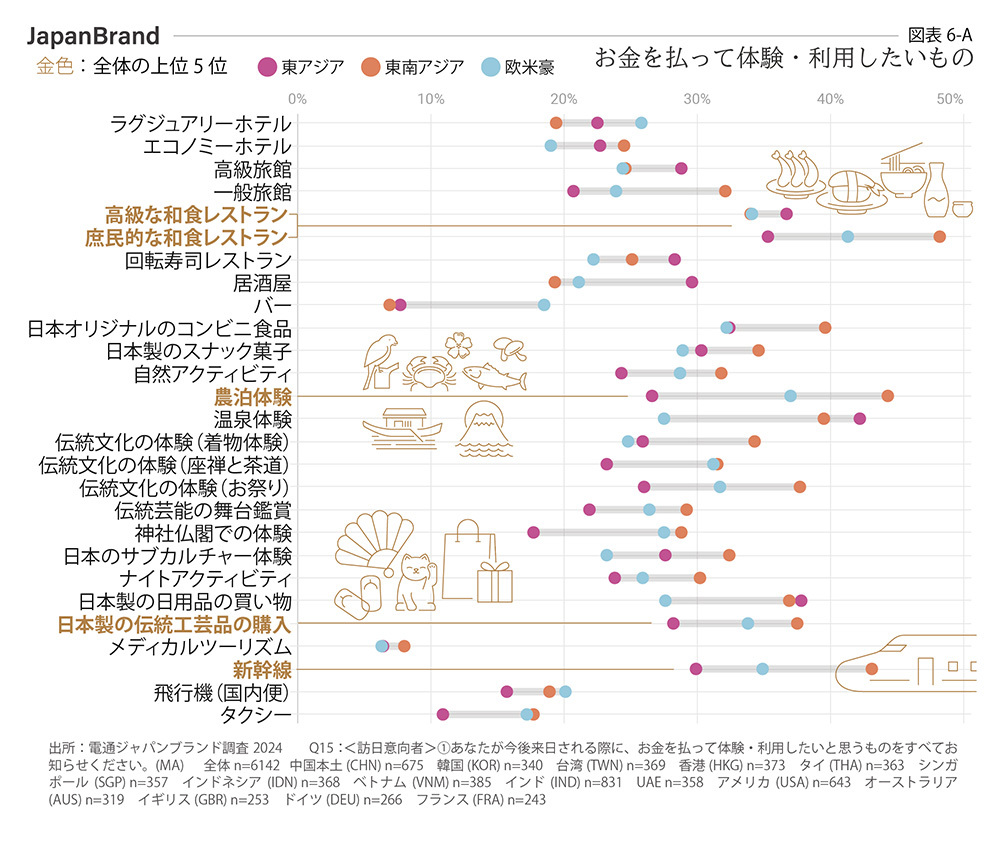
Now that we have reviewed interest in the Japan travel experience as a whole, in today’s climate—where the goal is to increase the average spending per visitor (i.e., boost on-site spending)—visualizing “what visitors are willing to pay for during their stay in Japan” is also considered a key priority.
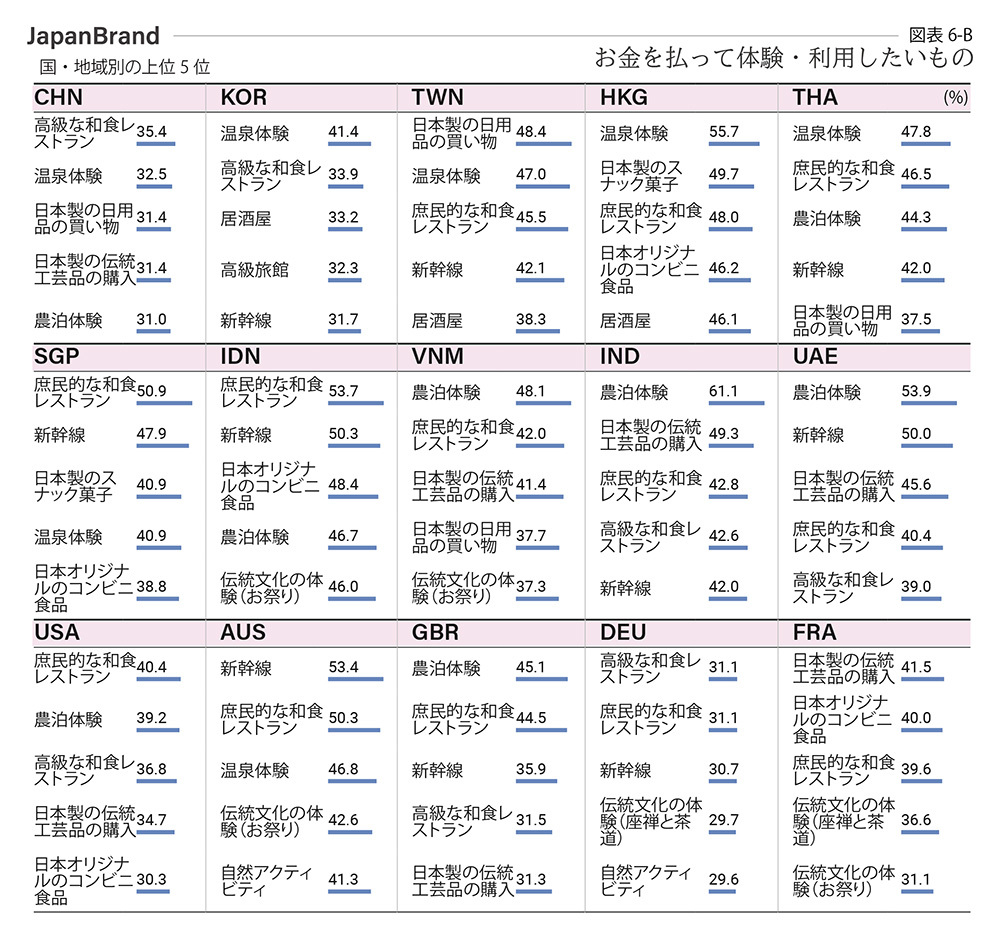
Therefore, this report visualizes nearly 30 paid experiences essential to tourism in the form of rankings by country and region. In addition to classic offerings such as dining and hot springs, we believe that “Japanese convenience store foods,” “traditional Japanese crafts,” “agritourism experiences,” and “Shinkansen travel” also have the potential to become high-value offerings that contribute to increased spending.
Furthermore, when examined by country and region, izakaya (Japanese pubs) ranked highly in South Korea, Hong Kong, and Taiwan—where repeat visit rates are high—indicating a trend toward seeking deeper, more authentically Japanese experiences. [Figures 6-A, 6-B]
Point 04: Regional Areas
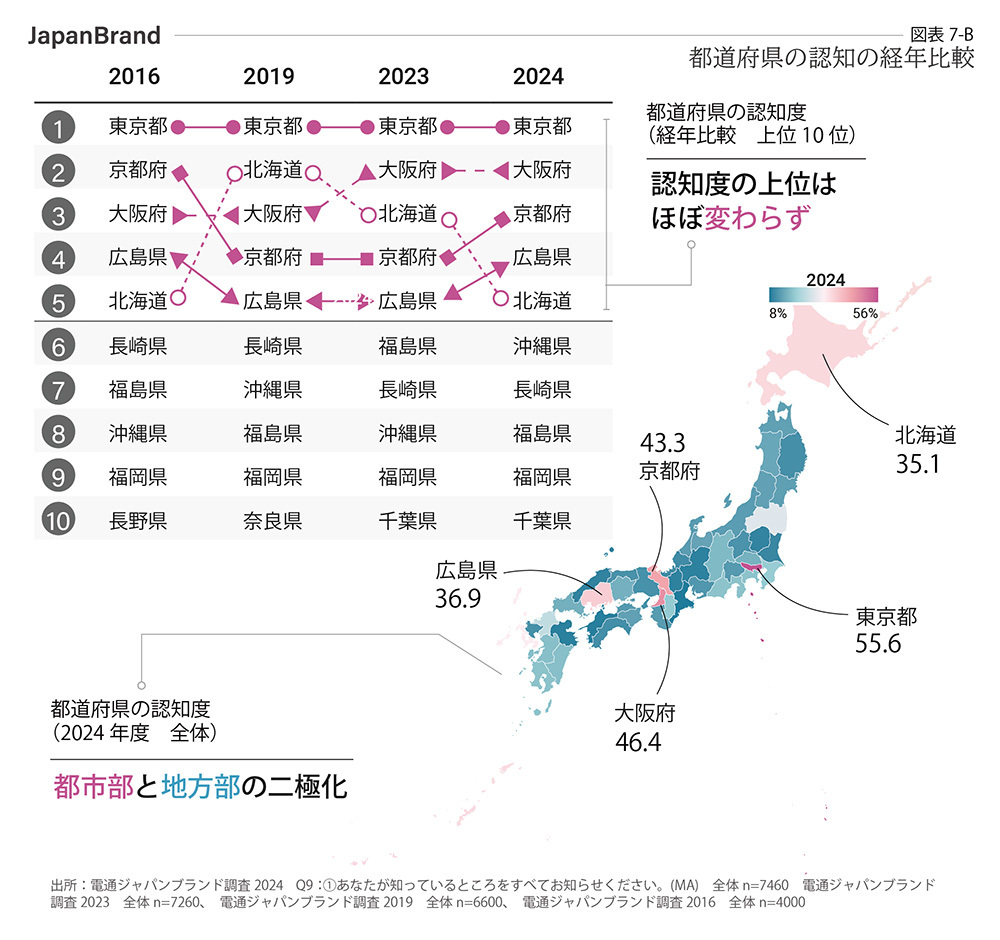
Attracting visitors to regional areas is believed to not only revitalize local communities but also help curb overtourism in urban areas. Along with refining the tourism resources unique to each region, it is necessary to regularly assess the current state of awareness—such as the extent to which these regions are recognized. The Japan Brand Survey regularly collects data on awareness, visit experience, and visit intent for each prefecture to support “zero-stage” analysis, and has been closely monitoring changes in these trends from an early stage.
The latest data shows that, regardless of region, “Tokyo” significantly outpaces the runners-up in all three indicators, demonstrating an overwhelming presence. When viewed by region, it is clear that Asia and Europe, the U.S., and Australia are in distinctly different phases for each indicator. [Figures 7-A]

On the other hand, prefectures other than the relatively well-known ones—Hiroshima, Nagasaki, Fukushima, Fukuoka, Okinawa, and Chiba—share a fundamental challenge: a lack of awareness. This polarization is by no means a recent phenomenon. A review of past surveys in this series revealed broadly similar trends. The top five in terms of awareness remained unchanged: Tokyo, Osaka, Kyoto, Hokkaido, and Hiroshima. [Figure 7-B]
Let’s also examine the situation by country. Comparing South Korea—Asia’s largest source market—with the United States—the largest source market in Europe and the Americas—we find that while awareness in South Korea is high for the so-called “Golden Route” and the Kyushu region, in the United States, Tokyo dominates overwhelmingly, far surpassing all other destinations. Furthermore, in both countries, the intention to visit correlates with awareness, and the vast majority of prefectures that are not well-known continue to have low visitation intentions. [Figure 7-C]
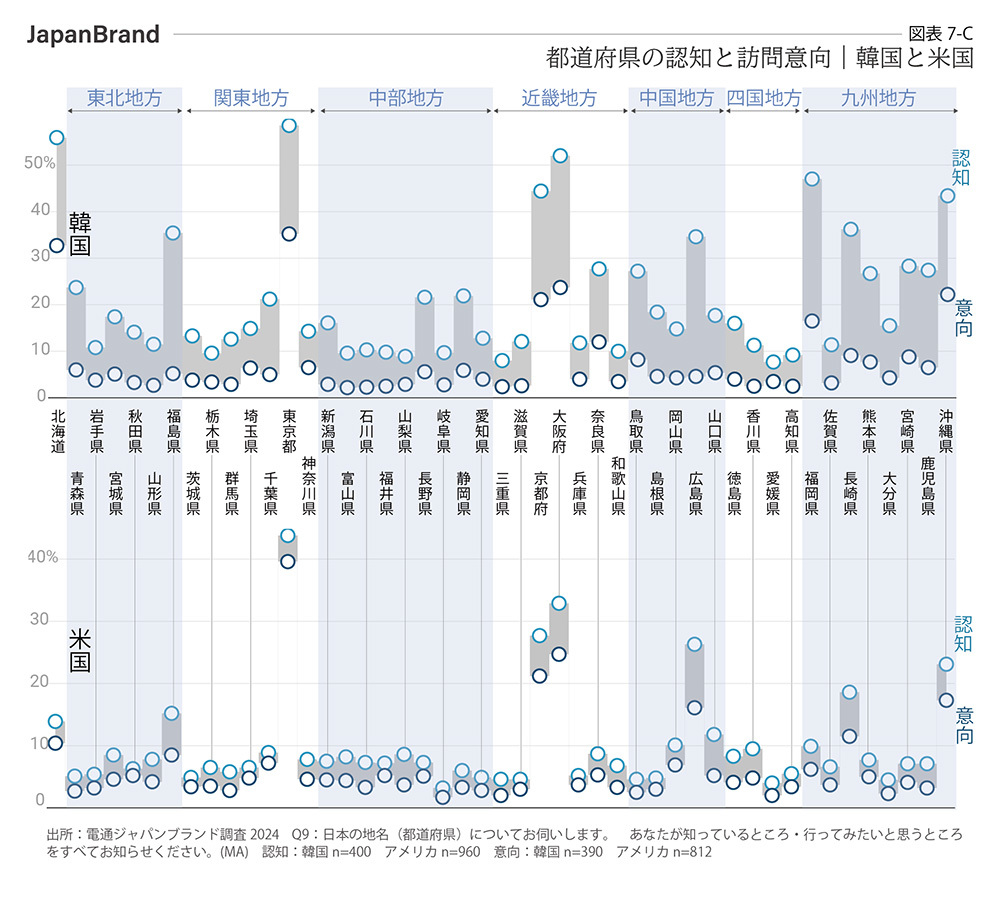
While awareness does not necessarily lead to a stronger desire to visit, a destination that is unknown is highly unlikely to even be considered as an option. Each municipality has its own vision for the future and unique assets, and the target markets that individual municipalities wish to attract often vary significantly.When comparing the “ideal” (To be) with the “current state” (As is), a gap inevitably exists. Which countries should we seek to attract to our regions, and which countries should we prioritize? In the gap between ideal and reality, we are called upon to make calm analyses and passionate decisions.
Point 05: Obstacles
Another factor to understand when attracting visitors to regional areas is the barriers to regional tourism. In this survey, we deliberately formulated some hypotheses while investigating these barriers and found that ① language issues and ② lack of information are the two major challenges for overseas residents.
As can be seen from the heat map below (where darker colors indicate higher scores), language is by far the biggest barrier. This trend is particularly pronounced among the potential customer segment that has never visited Japan.
The second major barrier is a lack of information across various levels. There is a fundamental issue: people are often unaware of regional tourist destinations outside of well-known cities, and there is a lack of information sources to help them learn about these places. Furthermore, a lack of information regarding secondary transportation—the means of getting to these regional destinations—is also a challenge.I surmise that the lack of understanding regarding Japan’s road conditions and traffic rules poses a greater obstacle than the means of transportation themselves—such as connecting transit (trains, buses, rental cars, etc.) or supplementary transportation (ride-sharing, etc.). [Figure 8]

As a side note on regional tourism, I’d also like to briefly touch on overtourism, which has become a growing concern in recent years. This is not a problem unique to Japan; virtually all famous tourist destinations around the world are struggling with the same issue of overtourism.
Currently, taking the pandemic as an opportunity for a fresh start, destinations are embarking on a variety of solutions, both large and small. The tourist experience, the quality of life for local residents, and the impact on social infrastructure and the natural environment are beginning to be reevaluated on a global scale. Each tourist destination is faced with the difficult decision of determining what should be its top priority. And one thing that can be said universally is that nowhere has yet found the optimal solution.
Point 06: Japanese Cuisine
Starting this fiscal year, we have introduced a survey item measuring the frequency of Japanese cuisine consumption by situation as one of the indicators to gauge the penetration of Japanese cuisine.
Regarding dining out and takeout, the rate of Japanese cuisine consumption at least once a month stands at around 70% in Asia and less than 60% in Europe, the U.S., and Australia. For home-cooked meals, the rate is less than 70% in Asia and less than 60% in Europe, the U.S., and Australia.
In Asia, the consumption rates for dining out and takeout are 10 percentage points higher than for home-cooked meals, whereas in Europe, the U.S., and Australia, that difference is negligible. This may reflect the dining culture in Asia, where eating out is well-established. [Figure 9]
*Regarding the definition of consumption situations
Take-home meals (purchasing prepared foods, takeout such as boxed lunches and side dishes, or delivery—food prepared outside the home and brought back to be eaten at home or at work)
Eating at home (cooking and eating at home)

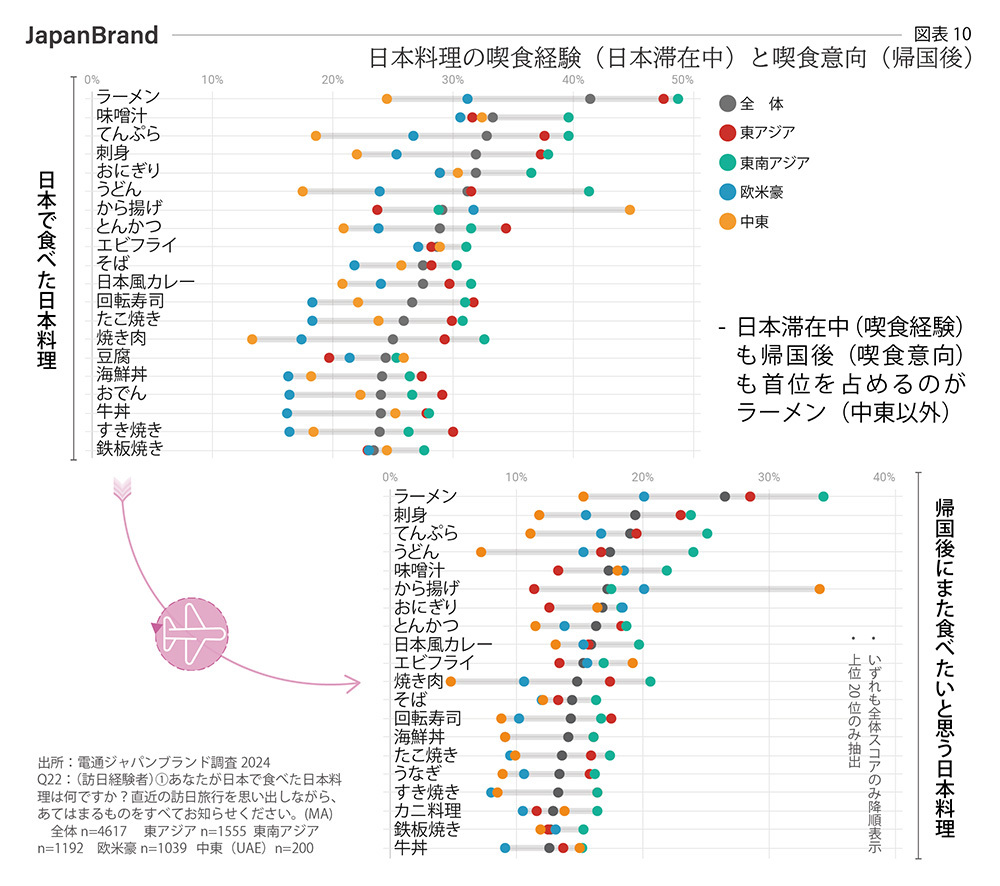
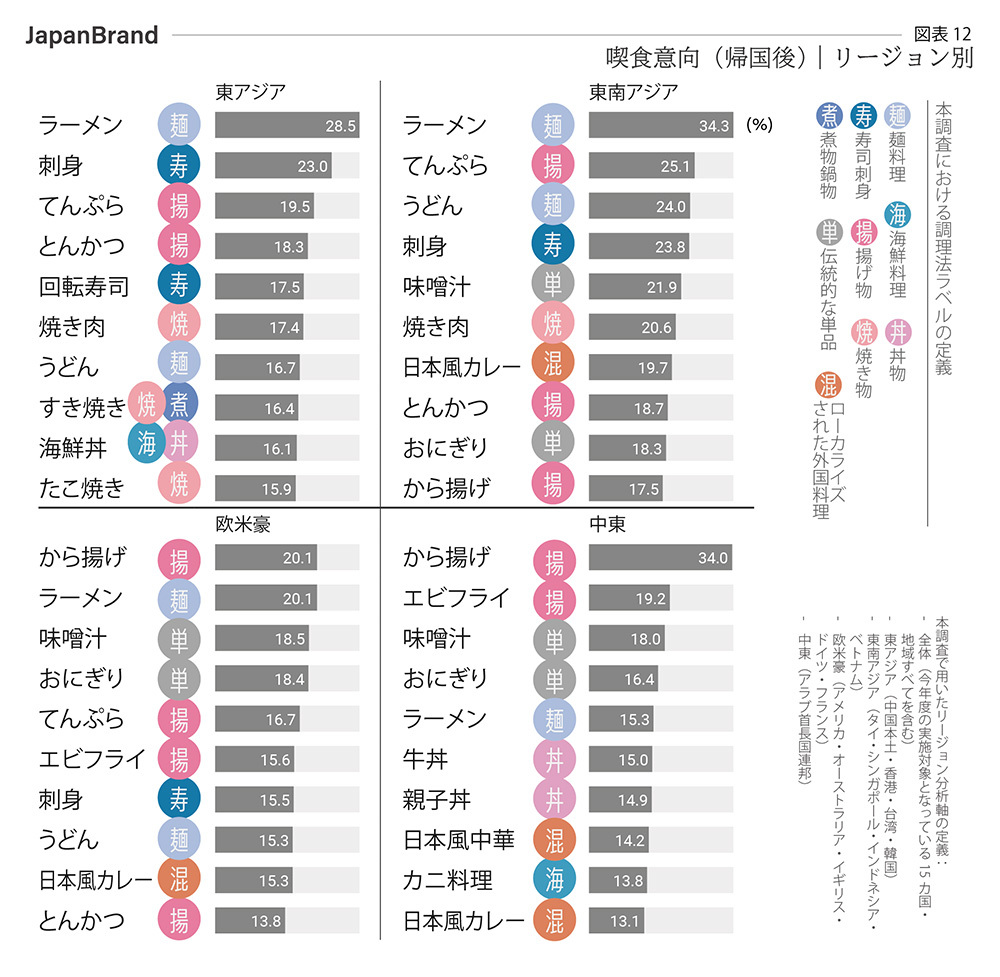
Next, we surveyed people who had visited Japan to find out what dishes they ate during their stay and which ones they would like to eat again after returning home. While there were no significant differences in the specific dishes themselves, ramen consistently ranked near the top both during their stay in Japan and after returning home.
Furthermore, “Japanese-style curry” ranked among the top 20 choices for both during their stay and after returning home, suggesting the significant global potential of curry, a staple of Japanese cuisine. [Figure 10]
Food is a category with significant regional variations, and when analyzed by region, we made several discoveries. For example, it became clear that there are large differences between regions regarding dishes such as karaage, yakiniku, ramen, tempura, udon, and sashimi. While karaage ranked first in the Middle East, Europe, the U.S., and Australia, interest in it was not particularly high in East Asia, where it ranked 25th. [Figure 11]
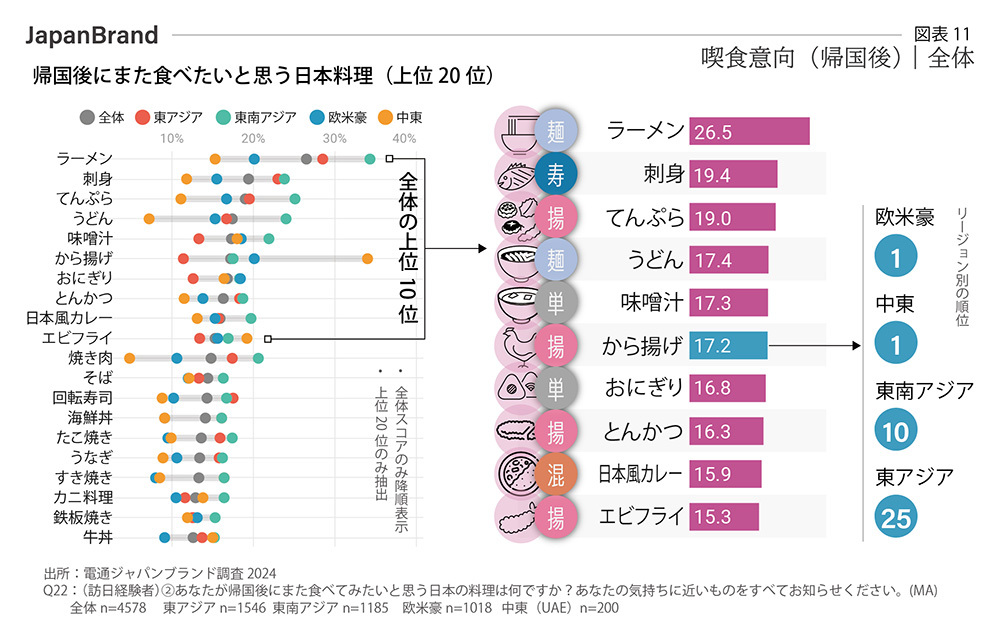
Furthermore, the food trends observed among the top-ranked items in each region offer valuable insights. Items that garner high interest across Asia, Europe, the U.S., and Australia include ramen, sashimi, tempura, tonkatsu, and udon.
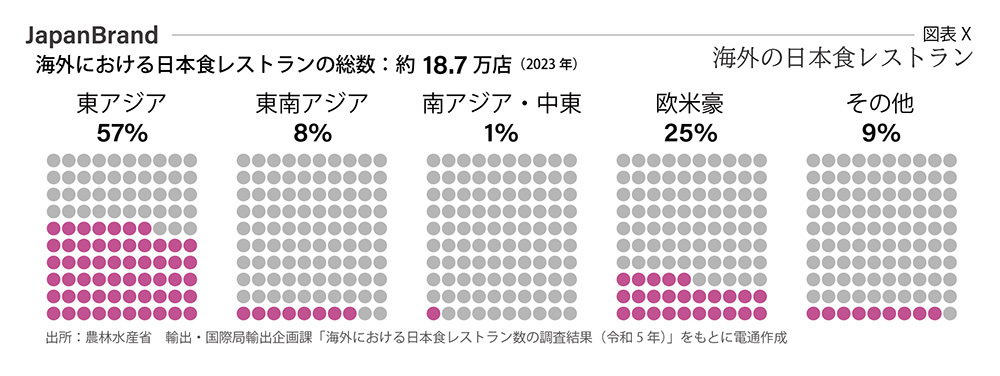
In East Asia, where there are more Japanese restaurants than in other regions (*) and where Japanese cuisine is relatively accessible, travelers express a wider range of dishes they would like to try again after returning home.
On the other hand, the Middle East shows trends that differ significantly from other regions. As the Middle East—a region attracting increasing attention as a source of high-value-added travelers—gains prominence, it will become increasingly important for restaurants in tourist destinations to understand the culinary preferences of this market. [Figure 12]
*Based on calculations using data from the Export Planning Division, Export and International Affairs Bureau, Ministry of Agriculture, Forestry and Fisheries, “Survey Results on the Number of Japanese Restaurants Overseas (Reiwa 5),” the total number of Japanese restaurants in East Asia accounts for approximately 57% of the global total. [Figure X]
Point 07: Appeal
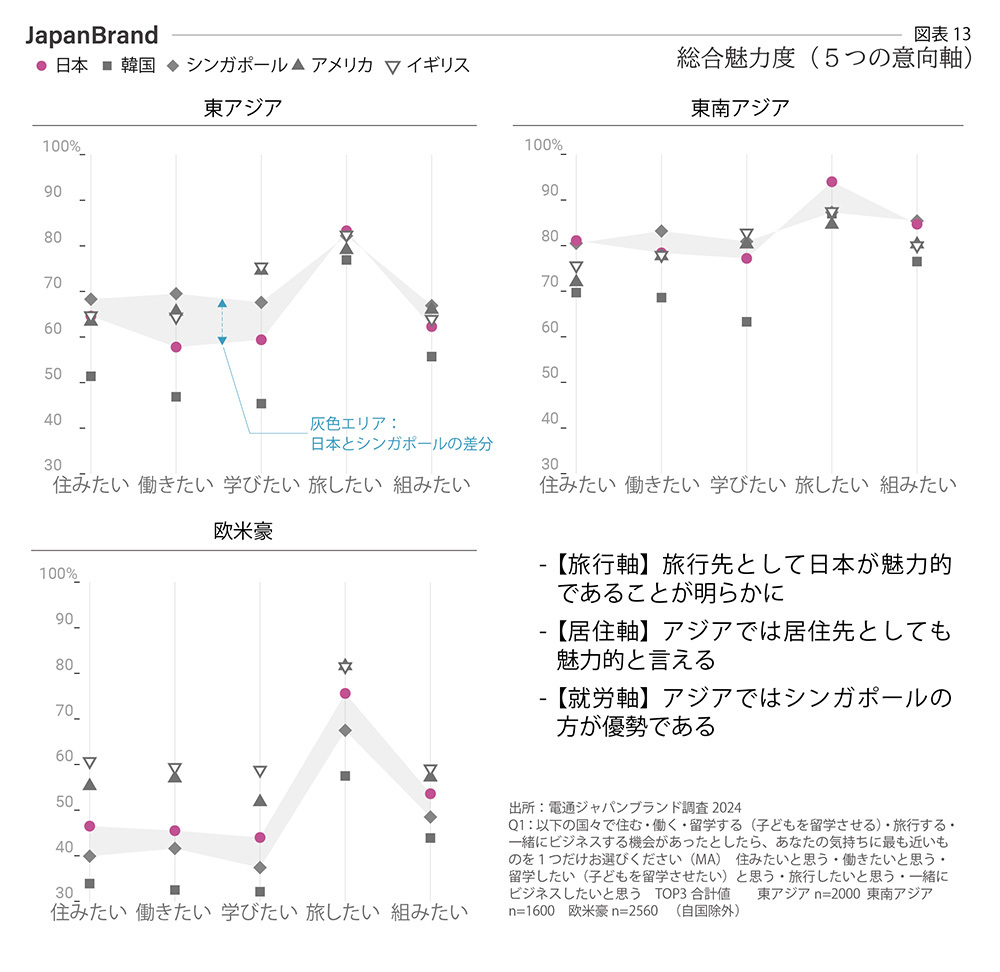
Last year’s Japan Brand Survey 2023 examined Japan’s overall appeal based on four intentions: living, working, studying abroad, and traveling. The results revealed a disparity in favorability, with Japan rated as “Excellent” from an Asian perspective and “Good” from a Western perspective.
In this year’s Japan Brand Survey, we decided to introduce a new perspective and conduct a comparative analysis with four countries (Singapore, South Korea, the United States, and the United Kingdom).
In evaluations from East Asia, the United Kingdom, the United States, and Singapore were neck-and-neck across all five categories (intention to live, work, study, travel, and serve as a business partner), with Singapore holding a slight edge over Japan. In evaluations from Southeast Asia, the results were closely contested across all countries except South Korea. When viewed as a place to live and as a business partner, Japan ranks at roughly the same level as Singapore.
The differences between Europe, the U.S., and Australia and the rest of Asia are clear; there is virtually no difference in various intentions toward the U.S. and the U.K., reflecting characteristics unique to the same cultural sphere. Japan ranks in the middle across all indicators and can be said to have a slight edge over Singapore and South Korea. [Figure 13]
Point 08: Employment
As competition among nations—including the battle for talent—intensifies, chronic labor shortages are becoming increasingly apparent across various industries. In addition to promoting women’s participation in the workforce and re-employing older workers, this sector is also expected to leverage foreign talent. Currently, various policies targeting foreign nationals, such as the Special Highly Skilled Professional Program (J-Skip) and the Training and Employment Program, are in effect. In this survey, we analyzed not only intentions to work in Japan but also the reasons behind them.
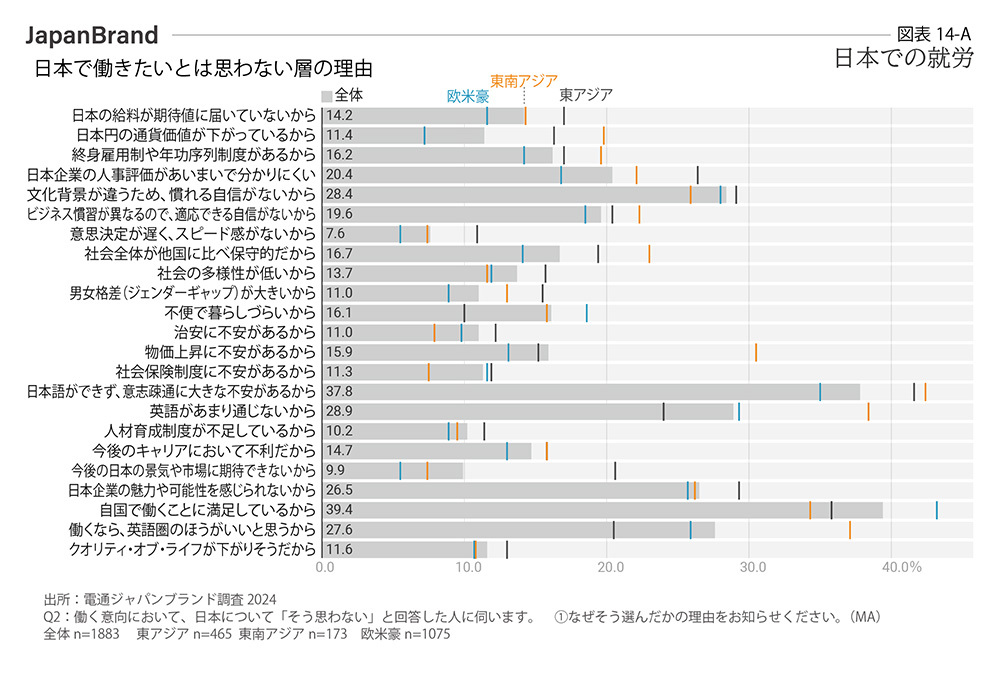
[Groups Unwilling to Work in Japan]
The primary reasons cited for not wanting to work in Japan are “I am satisfied working in my home country” and “I do not speak Japanese and have significant concerns about communication.” The scores for these two items are significantly higher than those for the third-place reason and below.
Next, when viewed by region, respondents in Europe, the U.S., and Australia do not appear dissatisfied with working in their home countries, whereas in Asia, concerns about the Japanese language are particularly prominent. Furthermore, expectations for Japan’s economy are lowest in East Asia. [Figure 14-A]
[Groups Interested in Working in Japan]
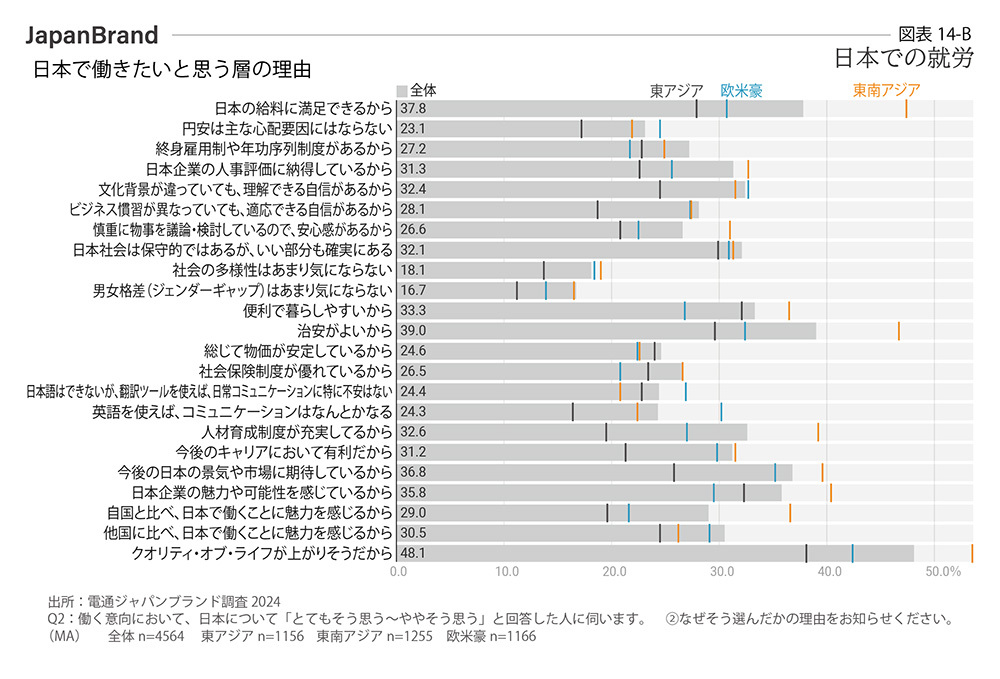
Overall, the top reasons cited are “improved quality of life,” “good public safety,” “salary,” “expectations for Japan’s future economy and market,” and “the appeal and potential of Japanese companies.”
When broken down by region, “improved quality of life” is consistently the top reason across all regions. This is likely a reflection of the widespread recognition of Japan’s high quality of life.
Among the three regions, Southeast Asia is most satisfied with “salary” and “good public safety,” while in East Asia, “convenience and livability” and “the appeal and potential of Japanese companies” were the main factors driving the intention to work in Japan. In Europe, the U.S., and Australia, “expectations for Japan” and “confidence in cross-cultural understanding” ranked highly. Additionally, items showing significant variation across regions include salary and employee development programs. [Figure 14-B]
Reflecting on these results, it is clear that the countries in Europe, the U.S., and Australia—which consistently rank highly in various indices reflecting national power and appeal—are all nations with a high “quality of life.” Attracting talent from these countries is inherently challenging, and it is easy to imagine that adding language barriers would drastically shrink the available talent pool.
On the other hand, regarding Asia, while Japan’s popularity in Southeast Asia is undeniable, when compared to countries that—like Japan—offer a high quality of life and where English is widely spoken, the question of where Japan’s competitive advantage lies is raised in a very direct and critical manner. As already evident from the aforementioned employment intentions, not only the U.S. and the U.K. but also Singapore emerges as a formidable competitor.
As the environment continues to change, I believe we cannot avoid a fundamental discussion of what we need to put in place to attract talent that will contribute to our national strength, while maintaining Japan’s unique character and attention to detail.
In Conclusion
Finally, I would like to conclude this report with two key concepts.
The first is the “Matthew Effect,” a concept proposed by American sociologist Robert King Merton about 55 years ago.
Whether it be nations, organizations, urban areas, or rural regions; tourism or employment—resources tend to concentrate even more in well-known or outstanding places, and these concentrated resources enable further evolution to even greater heights. Conversely, places that do not attract such resources are likely to follow a path of decline, with even their original resources at risk of being lost.
This concept confronts us with various realities and strikes me as a truly spot-on and universal observation.
The second term is “Idola.” Idola is a Latin word meaning “idol” or “illusion.” It is said that humans primarily have four types of biases. According to the “Four Idols” theory by Francis Bacon, the greatest intellectual of 16th-century England,
① The Idola of the Nation (illusions)
② The Idols of the Cave (preconceptions stemming from one’s environment or personal experiences)
③ The Idola of the Marketplace (rumors and conspiracy theories in the workplace or online)
④ The Idols of the Theater (blind faith in authority)
These are the primary assumptions and prejudices that plague our social lives.
We cannot escape the theory of the Idols outlined above, not only in cross-cultural understanding but also in highly homogeneous societies. The same applies to all market research and data analysis.
I encourage you to reflect on what it means to be “Japanese,” what sustainable prosperity entails, and what is necessary when engaging with the global community and other cultures—all while acknowledging that certain biases, which cannot be completely eliminated, exist in various aspects of work and daily life.
[Contact Information for Inquiries Regarding This Matter]
Dentsu Inc., Japan Brand Project Team
japanbrand@dentsu.co.jp
Japan Brand Survey Hub Page
https://www.dentsu.co.jp/knowledge/japan_brand/
[Purpose of the Dentsu Inc. Brand Survey]
Launched in 2011—when the Great East Japan Earthquake led to reputational damage affecting Japanese agricultural and marine products as well as inbound tourism—this is Dentsu Inc.’s proprietary commercial marketing research initiative designed to understand how products and services originating in Japan are perceived globally.The Japan Brand Survey regularly assesses overseas consumers’ perceptions and actual behaviors regarding the Japan brand as a whole, covering areas such as overseas travel, inbound tourism, culture, regional revitalization, Japanese cuisine, Japanese products, and lifestyle. By visualizing shifting consumer sentiments and the challenges and potential of the Japan brand, the survey contributes to increasingly complex corporate activities while also promoting cross-cultural understanding within Japanese society.
[Dentsu Inc. Brand Survey 2024: Survey Overview]
・Target Areas: 15 countries and regions (United States, Australia, United Kingdom, Germany, France, India, United Arab Emirates, Indonesia, Singapore, Thailand, Vietnam, Mainland China, Hong Kong, Taiwan, South Korea)
・Sample Size: 7,460 (Breakdown: United States 960, India 900, Mainland China 800, other countries and regions 400 each)
・Survey Period: January 19–March 26, 2024
・Eligibility criteria: Men and women aged 20–59 (middle-income and above)
・Survey Method: Online survey
・Research Organizations: Dentsu Inc. (Principal Investigator), Video Research Ltd. (Implementation Partner)
[Notes and Disclaimers]
*1: The target areas in mainland China are primarily Tier 1 cities; in India, they are Delhi, Mumbai, and Bengaluru; in Australia, the Sydney metropolitan area; and in Southeast Asia, they are primarily metropolitan areas.
*2: Definition of middle-income group: Criteria were established for each country based on average national income figures (such as OECD statistics) and socio-economic classification (SEC).
*3: Samples were collected using equal allocation by gender and age group in each country and region, and the data was weighted to reflect the population distribution.
*4: Since the composition ratios in this survey are rounded to the second decimal place (or to the first decimal place where displayed as whole numbers), the totals may not add up to 100%.
*5: In creating the charts and tables for this survey, the names of the countries and regions analyzed use the international standard ISO country codes (ISO 3166-1 alpha-2/3), with a few exceptions.
United States/US/USA, Canada/CA/CAN, Australia/AU/AUS, United Kingdom/UK/GBR, Germany/DE/DEU, France/FR/FRA, Italy/IT/ITA,Spain/ES/ESP, Finland/FI/FIN, United Arab Emirates/UAE, Saudi Arabia/SA/SAU, India/IN/IND, Indonesia/ID/IDN, Singapore/SG/SGP, Malaysia/MY/MYS, Philippines/PH/PHL, Thailand/TH/THA,Vietnam/VN/VNM, Mainland China/CN/CHN, Hong Kong/HK/HKG, Taiwan/TW/TWN, South Korea/KR/KOR
*6: The names of countries and regions used in this survey report and on our website are based on the Japanese government’s long-standing position, as well as Japanese social norms and business practices.
*7: The names of countries and regions used in this survey are for statistical or analytical convenience only and do not imply any political stance or opinion.
*8: The maps used in this survey (world map and map of Japan) have been partially modified and cropped to suit the analysis content and page layout; therefore, they may not necessarily reflect national borders and territorial boundaries accurately.
*9: As a commercial marketing research study aimed at understanding the lifestyle habits and brand preferences of general consumers, this survey has been conducted consistently since its inception through commissioned fieldwork partners, in strict compliance with local laws, regulations, and public order and morals.Surveys conducted in China are carried out through fieldwork contractors who have obtained the “Foreign-Related Survey Permit” required by Chinese authorities; our company does not conduct market research activities within China itself. Furthermore, we monitor and review our operational procedures as necessary in light of developments such as changes in laws and regulations.
*10: The response data collected through this survey is obtained, managed, and processed lawfully in accordance with the relevant laws and regulations of each target market. The data we receive consists solely of aggregated data that has been anonymized in a manner that does not allow for the identification of specific individuals and cannot be reversed; it does not contain any personal information.
Was this article helpful?
Share this article


Newsletter registration is here
We select and publish important news every day
For inquiries about this article
Author

Li Shunshi
Dentsu Inc.
First Business Transformation Bureau
Planner, Producer